Is there anything more frivolous than owning a high end bicycle? A watered down version of Chris Froome’s Tour De France winning Pinarello Dogma F10 will set you back about $15,000. You can buy a used bike from ebay that will essentially do the same job at a hundredth of the cost.
Owning a performance bike suggests that you have both the means to buy it (and the never ending servicing); and the available leisure time to ride it. To that end, the quality of bikes riding around the streets should provide a crude indication of relative living standards. Indeed, data on US bike sales maps closely to the ups and downs of the business (ummm…) cycles.
Canberra, Ottawa and Washington DC are all capital cities, sporting cultures and economic structures that are similar enough. A quick (Yelp/Google Maps) count of the bike shops in those cities finds the following.
- Ottawa — 5.4 bike shops per 100 thousand persons
- Canberra — 6.9 bike shops per 100 thousand persons
- Washington DC — 13.6 bike shops per 100 thousand persons
Roughly, these figures map to differences in living standards: Australia is a nose in front of Canada, but both are well behind the US.
- Canada — $43,240 per capita (measured in $US 2011)
- Australia — $44,156 per capita
- USA — $54,526 per capita
The last time Australia had a recession was 1991. Since then, per capita incomes have increased by about 50 per cent — more than any developed country in the OECD. However, despite this growth, living standards in Australia today are only now on par with what the Americans had in 1999 ($45,473).
That’s a record lag of 18 years — and one that continues to grow. Canada’s in a similar boat, their living standards have just caught up to 1998.
Years behind US living standards

Source: Penn World Table and me
Truth be told, the main reason for this record lag is the low growth environment that’s persisted since the GFC. Economic growth in Australia, Canada and the US has been a full percentage point below average ever since and catching up is going to take time when we’re all just creeping along.
Australia’s labour productivity falls between $6 and $11 per hour short of the Americans. Driving that is a combination of factors including the quality of capital, technology, know-how, management quality and economic structure. RBA Governor Philip Lowe attributes the dispersion of technology and productivity between leading and lagging firms to the “uneven ability of firms to innovate and use the new technologies.”
We are making some ground, but progress is slow: in 2017 Australia’s GDP per capita was 81 per cent of America’s; compared to 74 per cent in 1991. The gap shortened to a near record low (88 per cent) in the wake of the GFC, but the economy has been reverting back to mean levels ever since.
Relative living standards, Australia and Canada compared to USA
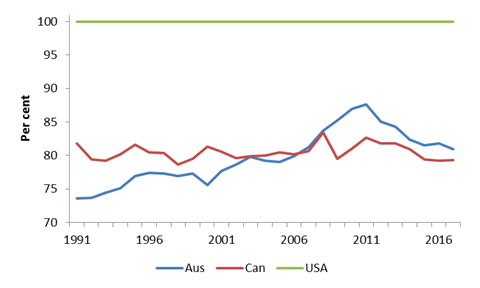
Source: Penn World Table and me
The persistence of the gap, and the growing time lag, is a mystery. Given the pervasiveness of communication technologies, one would think that the transfer and dispersion of knowledge would be quickening. But this doesn’t seem to be the case — if anything it’s theopposite.
Whatever the case, while the Americans are zipping around on their electricunicycles, 1999 vintage Pinarello’s are now reserved for ironic hipsters and retro rides.

Leave a comment