
Labour productivity grew rapidly in many OECD economies during the second half of the 20th Century. This was mostly the result of catching-up as nations adopted existing, but as-yet unexploited technologies. Once these catch-up wins were realised, productivity growth would revert.
The rapid dispersion of information and communication technologies in the mid-1990s spawned a new surge of productivity growth in the US. While some economies were able to follow in the US’ footsteps, for many their productivity story became one of divergence, rather than convergence.
Nations differ both in their capacity to learn from the global frontier, and in their capability to have that knowledge disseminated throughout the economy. The efficiency in which an economy can capitalise on lessons from the global frontier will determine whether or not they are a leader or a laggard.
The OECD’s Future of Productivity work program identifies six structural factors that are facilitate global frontier learning. In order of significance, they are:
· trade with the global frontier (a measure of the intensity of trade with the productivity leader in each manufacturing industry, Canada ranks number one)
· efficient skills allocation
· managerial quality
· business R&D expenditure and
· participation in GVCs.
“The role of trade is particularly important” write the OECD, “assuming a 2% acceleration in MFP growth at the frontier, the estimated gain to annual MFP growth would be around 1/3 percentage points higher in a country which trades intensively with the frontier (e.g. Canada), than in one where such trade is relatively weak”.
To a degree, we can see this playing out in the different ways Australia and Canada engage with the global economy.
Australia’s major trading partner is of course China. China accounts for about a quarter of Australia’s two-way trade, which is about as much trade as we do with our next three biggest partners the US, Japan and Korea combined. It’s a complementary relationship that’s been highly prosperous for both nations, but one that remains somewhat transactional. While this relationship is deepening, it’s a relationship that’s built on Australia selling iron ore and other commodities to China for flat screen TVs and other electronic consumables.
Compare this with the relationship Canada enjoys (?) with its major trading partner, the US. About $1.7 billion is traded over the US and Canadian border every day, along with 400 thousand people. The geographic and cultural proximity that the two nations enjoy allows for a much more integrated relationship. This drives greater flows of talent and investment, facilitates participation in GVCs, and is an important source of competition. There are far fewer cultural, linguistic and geographic barriers for an engineer to overcome when moving from say Chicago to Toronto, than Sydney to Beijing.
The chart below shows manufacturing labour productivity in Australia and Canada, relative to the US. Both Australia and Canada sit by the US in terms of our labour productivity. Unlike Canada, which has gained ground over the past decade, Australia’s relative position has at best kept steady.
Manufacturing labour productivity, Australia and Canada, relative to USA
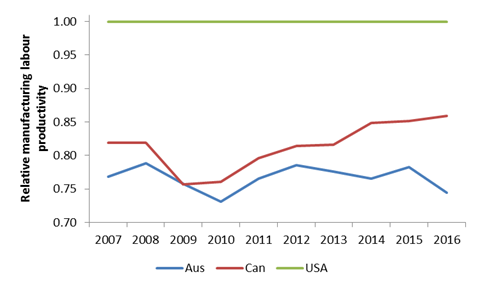
Notes: Labour productivity measured here as manufacturing value added per person employed in manufacturing
Source: World Bank and OECD
Successfully catching-up with the global frontier offers a promising source of future productivity growth. The reasons why Canada’s relative productivity has increased in this sector are undoubtedly plentiful, but the learnings acquired from their relationship with the US certainly help. For Australia, the tyranny of distance is not an unsurmountable constraint, however, it does highlight the importance of policy levers to help knowledge flow.

Leave a comment