
In the 12 months to August, the economy created 305 thousand net new jobs. Half of these jobs were created in the four months from May. Through the year employment growth is currently sitting at 3.1 per cent. This is the fastest employment in almost a decade.
We’re living in a mini jobs boom.
· 12 months of continuous job creation is the longest streak since July 1994.
· More people are employed in Australia than ever before, 12.3 million.
· The proportion of the population employed is now back to where it was in 2012.
· Unemployment is at a four year low (5.5 per cent).
· Labour force participation is the highest it’s been since 2011 (65.2 per cent).
· Real wages haven’t grown in years.
What’s really impressive is the growth in full time employment. Four out of five new jobs added over the last year have been full time — much higher than the usual three in five jobs that has been the experience since the GFC.
Of course, the week after the closure of the Holden assembly plant, it would be remiss not to mention that not all sectors are participating in the jobs boom. Indeed, over the last 12 months administrative services (-38 thousand), public admin (-24 thousand), (traditionally defined) manufacturing (-11 thousand) and a handful of other industries have shed a combined 100 thousand jobs.
These job losses have been offset four times over by gains made elsewhere. The biggest employers were health (+117 thousand jobs), construction (+83 thousand) and education (+49 thousand). (Actually, many of the jobs in administrative services are labour hire, so it could well be the case that these have become permanent positions in other industries, which would make the numbers look more impressive.)
The rise of household services in particular, and the decline of goods producing industries is typical of the structural changes that have been occurring for decades. Automation, technology, trade, policy, income growth and changing preferences are all forces that see resources pushed into one sector and pulled out of another. The chart below shows the cumulative job gains in growing industries over the last 10 years and compares them against job losses in declining industries.
Cumulative job gain/losses, 2007-2017
 Notes: Declining industries are those that employ less people today than 10 years ago and include agriculture, manufacturing, wholesale trade, media and rental and real estate services. Growing industries are everything else.
Source: ABS data.
That’s the good news, here’s the bad.
The jobs created in the last year have been typically in sectors with productivity levels that are lower than average (see chart below). The output generated in sectors like health, construction, hospitality, retail and education is lower on an hour by hour basis than sectors like mining and finance — which are not part of the recent jobs boom. This structural shift is partly why productivity is dragging.
Employment creation and productivity, August 2016-August 2017
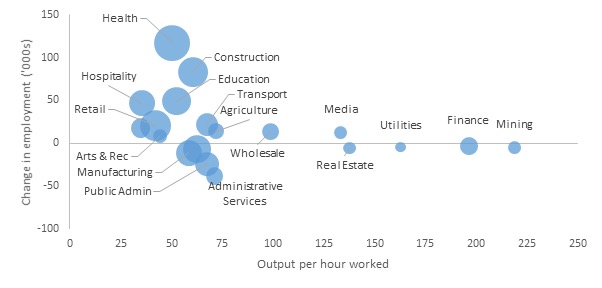
Source: ABS data.
The answer here of course, is not about stopping the shift towards services (cf. King Canute). The answer is to look at the ways of making the services sectors more productive.

Leave a comment