
The problems with Australia’s innovation system are not anything new. Go back over the last couple of decades and you’ll find a string of reviews, plans, inquires and roadmaps all testifying about the importance of innovation and the need to lift our game. Here are some examples that sound somewhat familiar.
“…developing skills, generating new ideas through research, and turning them into commercial success—is key to Australia’s future prosperity. Innovation is not only the province of new or high tech industries, but also essential to the future of many of our traditional sectors such as agriculture, manufacturing and mining.” (Backing Australia’s Ability, 2001)
“The overall conclusion is that public support for science and innovation has, by and large, provided widespread and important benefits for Australians. Nevertheless, there is room for considerable improvement in key areas of Australia’s innovation system, spanning ineffective business programs, a sometimes excessive focus on the commercialisation stages of innovation, problems in scientific labour markets, inadequate evaluation methods and problematic funding models.” (PC 2007)
“…the architecture of Australia’s existing national innovation system is now a generation old. It requires reappraisal and the policies it comprises require renewal, refurbishment, recasting and in some cases re-imagining.” (Cutler Review, 2008)
“…the findings in the ISR System Review make one thing very clear: we need to significantly lift our game if we want to be a top tier innovation nation.” (ISA 2017)
You’ll also find programme after programme that’s trying to fix the system — the latest being the suite of initiatives coming out of the NISA.
With all this effort, have we made any progress?
One of the key measures used to assess the health of the innovation system is Business R&D intensity. Business R&D intensity measures how much businesses are investing in R&D per dollar of gross value add (GVA) created. It is an indicator about the investment in new knowledge.
Australia’s R&D intensity has been below the OECD average for over a decade, but that gap has been narrowing. Between 2006-07 and 2014-15 Australia’s R&D intensity increased by about 10 per cent — a little more than 1 per cent per year.
Despite what might seem like a rather mediocre improvement, R&D intensity at a sectoral level has been surprisingly strong. Two thirds of industries invested with greater intensity in 2014-15 than they did eight years prior. And of those, half actually increased their intensity by a factor of two or more. These differences can be seen in the chart below.
Annual change in Business R&D intensity by industry, 2006-07 – 2014-15, per cent

Source: Based on ABS data.
Why do these positive sectoral results not show up in the aggregate?
The answer is structural change. Australia has steadily shifted away from agriculture and manufacturing, and towards services industries. Whereas a hundred years ago, one in three workers were employed in primary industries, the figure is more like one in 30 today. Manufacturing accounted for one in four jobs between the 1950s and 1970s, but today accounts for less than one in 12.
Structural change is important because there is a stark difference in R&D intensity between sectors. At one end of the spectrum we find industries like Transport Equipment Manufacturing, which invests $102 per $1000 of GVA generated; Machinery and Equipment Manufacturing ($94); Aquaculture ($86); and Basic Chemical and Chemical Product Manufacturing ($77). All well above the industry average of $15. At the other end of the spectrum we find a very long tail of industries that fail to invest even $2. These industries are mostly services and include Residential Care Services, Social Assistance Services and Preschool and School Education among others. This spread is presented in the chart below.
Business R&D intensity by industry, 2014-15
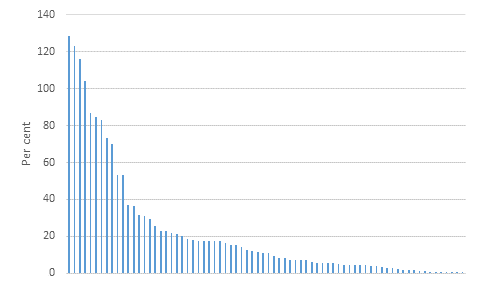
Source: Based on ABS data.
As the economy drifts away from those sectors with high intensity, and towards those with low intensity, there is a drain on our overall investment in new knowledge – which is what we see in the data.
We can actually measure the size of these competing forces by splitting out the “within industry” and “between industry” effects. The within industry effect shows how R&D intensity would have improved in the absence of structural change (26 per cent). The between industry effect shows the opposite — holding each industry constant, what impact did structural change have on R&D intensity (-16 per cent)?
Decomposing the change in Business R&D intensity, 2006-07 – 2014-15
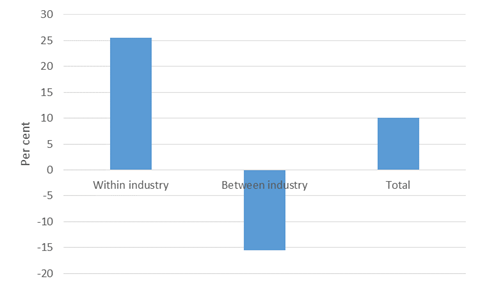
Source: Me.
The overall story is as we expected. Business are investing more in R&D, but those gains are being offset by growth in sectors with low R&D intensity. If it weren’t for the effects of structural change, we might expect Australia’s R&D intensity to be more than double what we actually recorded.
We cannot stop structural change (nor would we want to). As the economy continues towards greater servitisation continues, it is worth thinking about how what is really what is feasible and how we define success.

Leave a comment